Can I read two decimals of spots and areas in ResearchIR? In the Results Analysis tab, I see only one decimal place, I need to plot higher resolution of for instance Area average.
Yes, you can! You will have to use the formula function, where you can set the required precision 0 to 5 decimal places.
Under the menu Image - Edit Formulas..., click Add - Connect and choose the measurement function that you want to use. Then choose Precision from the drop-down list and click OK. You can name the formula as you like.
The formula will appear in the Result tab with the required precision.
The formula result can be used to plot and Export values in the same way as any measurement tool.
Related Articles
-
 Application Story
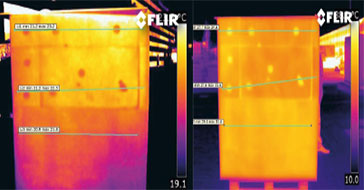
FLIR cameras support analysis and diagnosis of external thermal insulation systems
Read the Story -
 Case Study
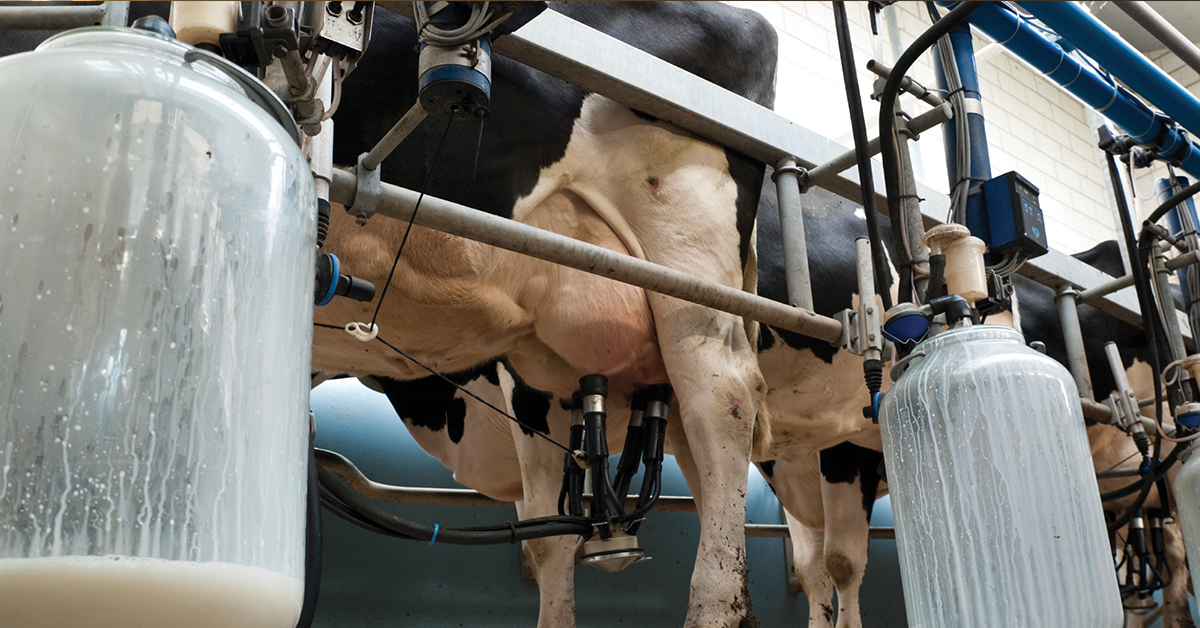
Automatic Health Check in Dairy Farms Using FLIR Thermal Imaging Cameras
Read the Story -
 Deep Learning
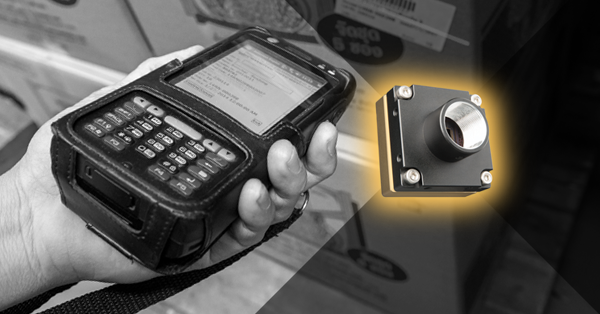
Comparing Deep Learning Cameras with Smart Cameras
Read the Story